
|

|

|
|
|
|
|
Introduction The recent finding of abundant, apparently young, Martian gullies with morphologies indicative of groundwater seepage and surface runoff processes (1) was surprising in that volumes of near-surface liquid water of sufficient quantity to modify the surface geology were not thought possible under current conditions (2,3). The patterns and associations of the three landforms that comprise the gullies, namely the alcoves, aprons, and major/secondary channels, are similar to terrestrial groundwater features. The channels, which exhibit anastomosing patterns and discontinuities suggesting subsurface fluid flow (piping), seem inconsistent with dry debris flow and other geologic processes (1). This discovery has therefore called into question our current understanding of the stability, transport processes, and geologic role of water on Mars. Reported here are new observations showing that some Martian gully channels exhibit ephemeral dark spots in the early spring. Our observations of these puzzling features indicate that they result from subtle, yet distinct, differences in thermophysical properties between the channel fill material and surrounding terrain. The use of Thermal Emission Spectrometer Data has been pivotal in our investigation of these features.
Methods The investigation of the Martian gullies utilized MOC, MOLA, and TES data. Here we focus on the latter. TES was used to "normalize" radiametrically-calibrated MOC data and to determine surface temperatures and the presence of solid CO2 on the surface.
To determine relative brightnesses within images, MOC frames were radiometrically calibrated to approximate radiance over the NA bandpass of 0.50-0.90 µm and adjusted for lighting geometry and Mars Orbiter Laser Altimeter (MOLA)-derived surface slopes by assuming a Lambertian surface. The MOC calibration procedure produces relative radiance differences among pixels in an image that are fairly accurate. However, comparing the calibrated radiances between and among images is problematic due to factors unique to each image, such as atmospheric haze and seasonal variations in insolation. To provide a first order normalization of the MOC data, Thermal Emission Spectrometer (TES) Lambert albedos (0.3-3 µm bandpass) were found for the same area and time as the MOC images (Figure 2). The TES pixels were overlaid on MOLA maps so that the TES albedos could be correlated to the geographic region they represented. In all cases, TES values varied up to 0.015 in albedo from mean on flat plains, the most extensive terrain type near the gullies. The MOC images contain portions of these flat plains with fairly constant radiances. Therefore, the ratio of TES plains Lambert albedo to MOC plains Lambert radiance was multiplied by all MOC radiances within the images, thereby producing a first-order absolute radiometric calibration (TES absolute calibration is good to ~2%). Using these values, brightnesses in different MOC images were compared (because these derived values are not true albedos, a more representative term is relative albedo, which is designated henceforth as A*).
TES brightness temperatures acquired at the same time and location as the MOC images were examined to confirm the presence of solid CO2 and infer regional (3 x 6 km) thermophysical properties. Brightness temperatures at 18 µm (T18) and 25 µm (T25) were used. For cold temperatures, the T18 band provides the best measure of surface kinetic temperature because it is least affected by emissivity variations caused by dust and solid CO2 (4). T25 is sensitive to solid CO2 spectral variations (10) and has brightness temperatures at or below the carbon dioxide sublimation temperature if solid CO2 dominates the field of view. The T18 and T25 values were compared to CO2 sublimation temperatures expected for the surface atmospheric pressures at the given season and location (5,6). TES Lambert albedos were also used to infer the presence of frost because the albedo of frost covered regions (5) is generally greater than those in areas lacking frost, which have phase-angle-corrected albedos less than 0.35 (7,8).
Observations
Early Spring An early spring image shows that gully spots are located almost exclusively within the gully major and secondary channels and are lacking on the gully alcoves, gully aprons, and the surrounding terrain (Figure 1-left). The calibrated MOC albedos (A*) of the illuminated spots is 0.09, lower than anywhere else in the non-shadowed portion of the image The non-spot illuminated channel material has A* values slighter greater, at 0.10-0.13, with the non-gullied portion of the illuminated wall at 0.11. Although the differences in A* between the illuminated spots versus the non-spot illuminated channel material and illuminated wall are small, they are proportional to the tonal variations in the MOC images, giving confidence that the A* values are representative of material brightness. The flat plains extending from the top and bottom boundaries of the pit slope are much brighter, with A* values of 0.34-0.44. Regional daytime T18 and T25 brightness temperatures are 147 and 141 K, respectively, compared to a CO2 sublimation temperature of 145-146 K. The TES-derived regional Lambert albedo is 0.34.
Late Spring In the late spring the same gully channels lack spots and instead contain dark material (Figure 1-right). The location of this material largely mimics that of the channel bright material seen in the early spring. A* for the dark channel fill is 0.12-0.13, with the rest of the pit slope at 0.14 ( as with the early spring A* values, the differences are small, but nevertheless proportional to tonal variations seen in the MOC image). These values are similar, within the error in the methods used, to the values in early spring. However, the plains adjacent to the pit wall are much darker than in the spring, with A* values of 0.17-0.19. Regional TES T18, T25 and Lambert albedo values are 265 K, 266 K and 0.16, respectively.
Martian Analogs to the Gully Spots Dark spots within the seasonal northern and southern caps have been observed in two other classes of terrain and their characteristics provide some insight into the origin of the gully spots:
Polar Dunes High resolution MOC images show that north and south polar dunes are the first surfaces to become frosted in the autumn or winter and the first features to exhibit spots in the spring or summer, with the spots growing and coalescing as the season progresses and temperatures become warmer (9,10). We analyzed MOC and TES data of a defrosting polar dune field located at 72.4° S, 178.8° W, using the methods described above. The dune dark spots and non-spotted portions of the dunes have A* values ~0.2 greater than the gully spots and gully channel non-spotted areas, respectively. Despite the different A* values in the two areas, the relative differences between the dune spots and their immediate surroundings and the illuminated gully spots and their immediate surroundings is, in both cases, about 10%. Regional daytime TES T18, T25 and Lambert albedo values are 148-150 K, 144-146 K and 0.28-0.35, respectively. The CO2 sublimation temperature for this area at this time of year is 144-146 K (5,6).
South Polar Layered Terrain Dark spots associated with springtime defrosting are also found in the south polar layered terrain (SPLD), but curiously have not been identified on the north polar layered terrain (NPLD). The appearance of dark spots against lighter-toned terrain is obvious. In this case, wispy tendrils of dark material are seen to radiate northward from the central, darker nucleus of many spots. The lack of nearby daytime TES data prevented calibrating the MOC radiances to A*. Nighttime TES T18 and T25 values are both about 143 K, with a predicted CO2 sublimation temperature of 143-145 K. The difference in brightness temperature, T18-T25, is only ~0.3 K. This relatively flat emission spectrum is indicative of CO2 ice with variable dust content.
Interpretations
The following apply to all dark spots examined: 1) Their occurrence coincides with the time when surface temperatures are close to that of CO2 sublimation. 2) They are the darkest features in the local regions they occur in and are about 10% darker than immediately adjacent areas. Two hypotheses seem consistent with these observations that they are either defrosting features (9,10) or coarse-grained CO2 ice (4). Arguments for and against these hypotheses will be discussed.
References
(1) M.C. Malin, K.S. Edgett, Science, 288, 2330-2335 (2000). (2) Carr, M.H., Water on Mars, Oxford University Press, Oxford, 229 pp. (1996). (3) K.L. Tanaka, Science, 288, 2325 (2000). (4) H.H. Kieffer, T.N. Titus, K.F. Mullins, P.R. Christensen, P.R., J. Geophys. Res. 105, 9653-9699 (2000). (5) P.B. James, H.H. Kieffer, D.A. Paige, in Kieffer, H.H., B.M. Jakosky, C.W. Snyder, and M.S. Matthews, Mars, Univ. Arizona Press, Tucson, p. 934-968 (1992). (6) Pressure in mb for the nearest Ls=30° was determined from results of the Ames Mars General Circulation Model found at http://humbabe.arc.nasa.gov/mcc/windsm_gif.html. (7) L.K. Pleskot, E.D. Miner, Icarus, 45, 415-426 (1981). (8) P.R. Christensen, J. Geophys. Res., 93, 7611-7624 (1988). (9) M.C. Malin, K.S. Edgett, K.S., Lunar Planet. Sci. XXXI , 1056 (2000). (10) K.S. Edgett, K.D. Supulver, M.C. Malin, M.C., 2nd International Conference on Mars Polar Science and Exploration, 4041 (2000).
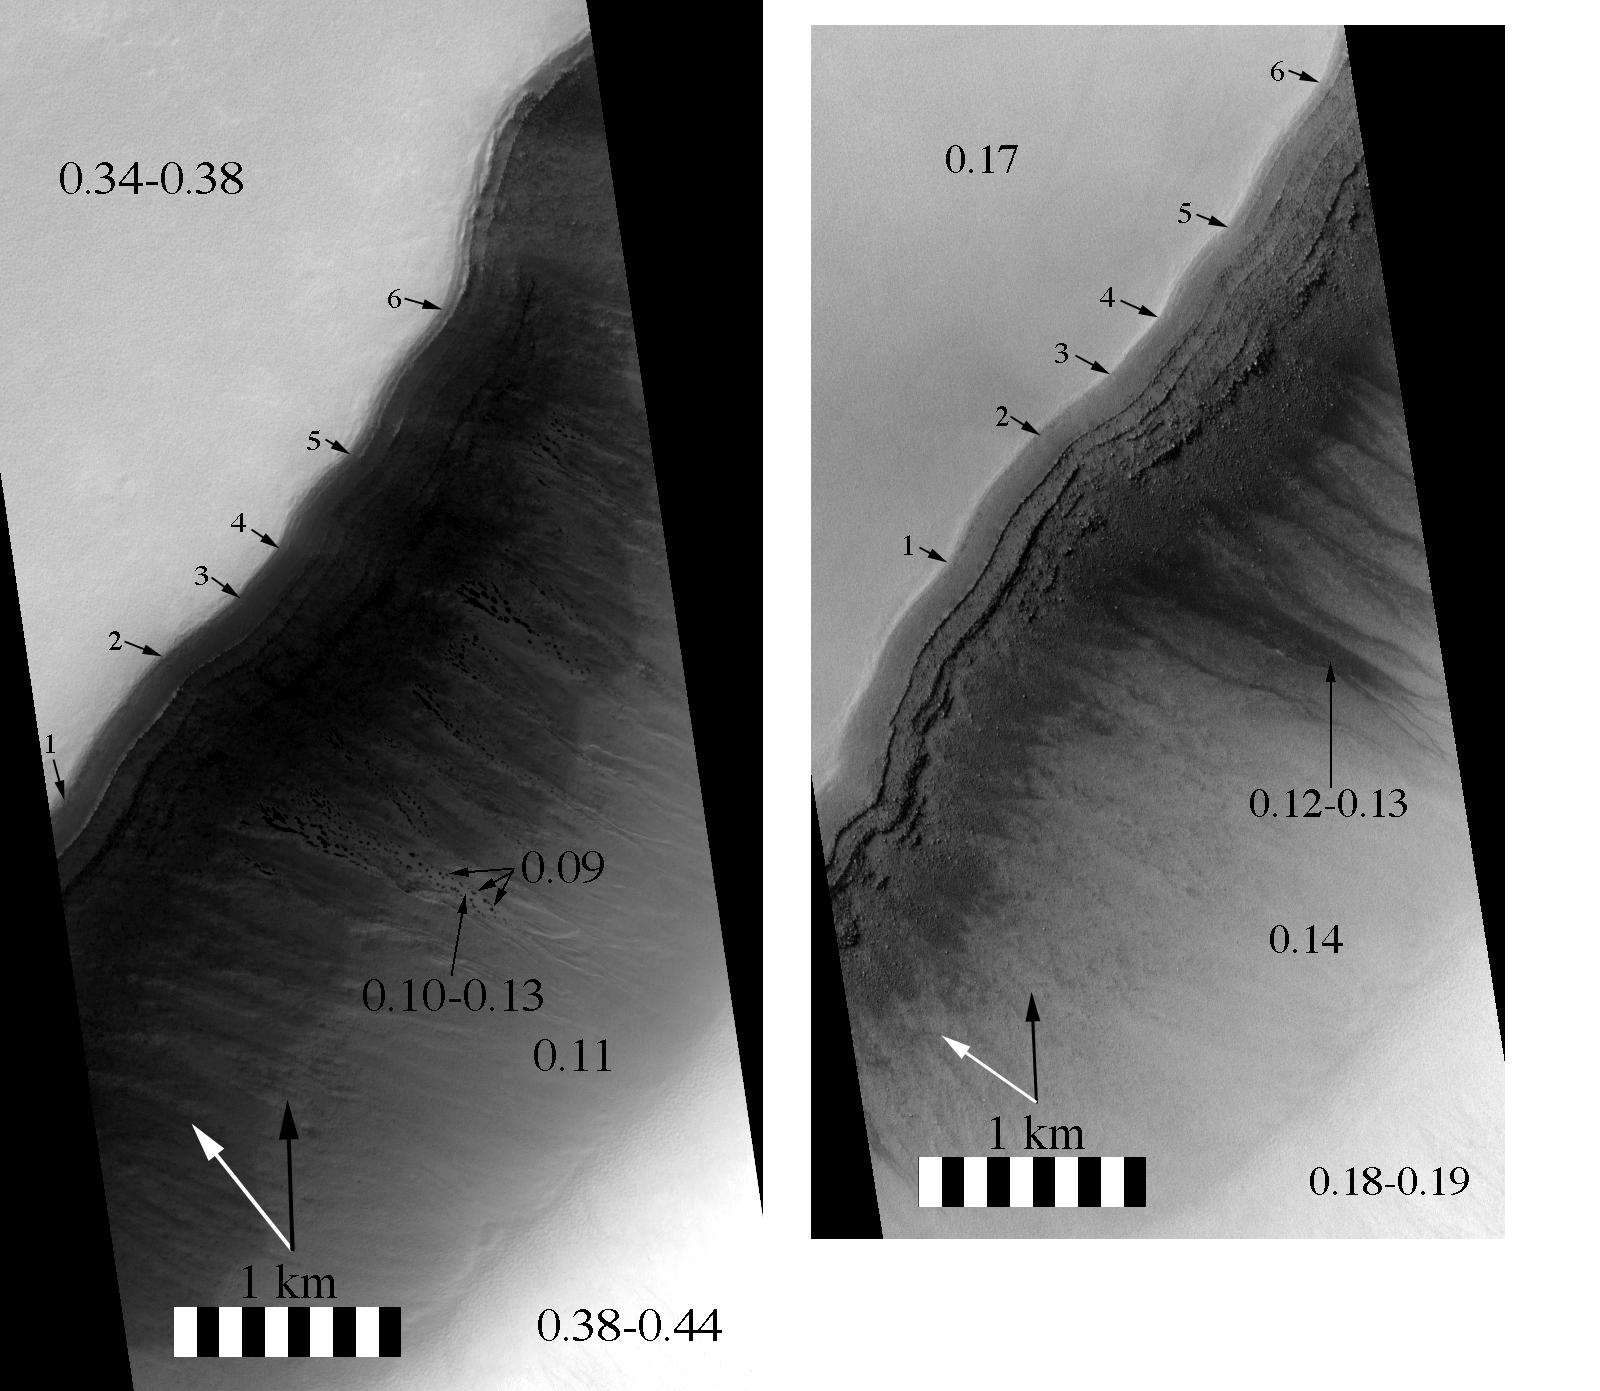
Figure 1: Seasonal changes seen in gullies. Left) Portion of MOC image M03-07645 showing dark spots within gully channels at Ls = 185 (early spring).; Right) Portion of MOC image M09-02965 showing the same gullies as on left, but at Ls = 243 (late spring). Both images are in sinusoidal projection. Shown are scale bar, north azimuth (large black arrow), azimuth to Sun (white arrow), and tie points to image at right (numbered arrows). Number ranges are relative albedos derived from MOC radiometric calibration and TES albedo "normalization."
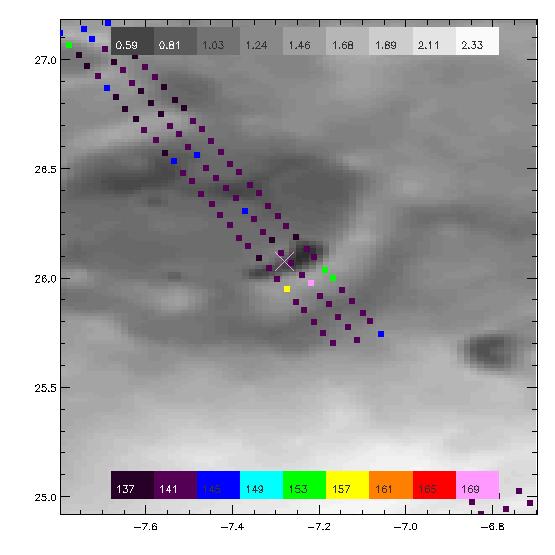
Figure 2: TES footprints overlaid on MOLA topography near the pit seen in MOC images M03-07645 and M09-02965 (Figure 1). The "X" is the center of the MOC image. Scale is 25 µm brightness temperature. The data here is at the same time as image M03-07645 in the early spring. The temperatures are below 145-146 K, the CO2 sublimation temperature at this elevation, indicating that CO2 frost or ice is abundant on the surface. Using this method, developed by co-author T. Titus, we can determine TES brightness temperatures and albedos for areas near the MOC images of interest.